

Long-time users of business aviation understand that the benefits of private air travel far outweigh the costs involved. These existing private fliers slowed travel briefly in 2020 due to pandemic-related travel restrictions, but their return to more active travel schedules in 2021 increased demand for jet aircraft. As travel logistics put a spotlight on the efficiency and safety of private air travel, others reached a tipping point and joined the ranks of business aviation users, many for the first time. Fractional and charter operator offerings were snapped up, used turbine aircraft inventory decreased to historic lows, and aircraft manufacturers’ order books filled up.
Annually, NATA asks Aviation Resource Group International to assemble data for the TOP 500 airports. Last year we reported the steep drop off in activity and wondered about the shape of a recovery—or if a recovery would ever occur. And now we know.
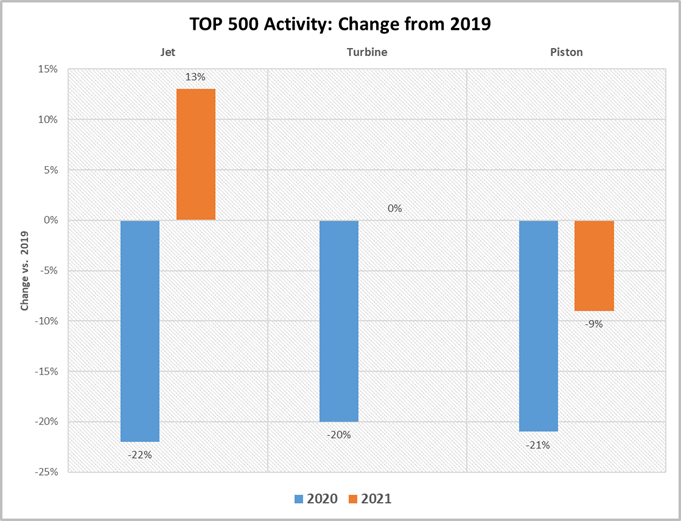
Comparing activity levels to 2019: Jet arrivals and departures increased 13% in 2021 after a 22% decline in a tumultuous 2020—a brisk recovery and then some—while 2021 turbine activity regained 2019 levels and piston activity resumed a more normal decline.
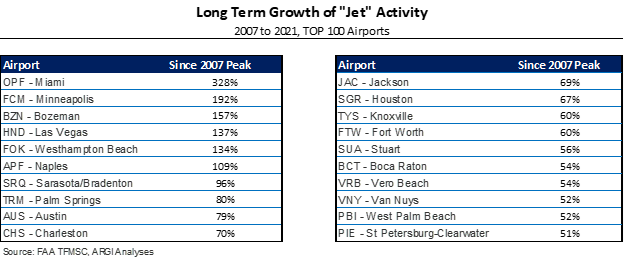
Source: FAA TFMSC, ARGI Analyses
In addition to assessing recent growth or decline in an airport’s activity, measuring longer-term demand for aviation services shows the level resiliency to economic and local challenges that are sure to occur. Such long-term trends are useful to support facility development, which typically takes years to plan, finance, and complete. After a 2007 peak in activity just prior to the Great Recession (2008-2010), few airports regained that peak in the years that followed, leading to claims that our industry was stuck in a “new normal” and that the “BRIC” countries would emerge as leaders in the growth of private aviation. But steadily, U.S. business aviation has demonstrated resiliency with an increasing number of airports reaching and exceeding 2007 peak activity levels. In 2021, 307 of the TOP 500 airports had done so. More active airports with the highest growth rates are shown below:
Business aviation activity growth has spurred facility development projects at the majority of TOP 500 airports as existing hangars reach full occupancy. With today’s building costs, FBOs and other developers are finding ways to increase hangar revenue yield to support reasonable financial returns. An instructive example is Sky Harbour, a now-public company (NYSE: SKYH, Sky Harbour Group Corporation) that has completed several successful hangar projects. In contrast to most FBOs, the Sky Harbour business model is real estate-based rather than reliant on fuel sales. The company touts a 30% return on equity and targets 50 airports for facility development.
The airport-by-airport analyses rank the TOP 500 airports based on 2021 jet activity and also show data and trends for the turbine and piston categories. 2021 growth rates are calculated from 2019 in order to eliminate 2020 abnormalities, hence the percent growth is over two years. Airports and FBOs can use the data to track trends and compare
activity data with other airports in a particular region.
I hope the accompanying listing of the TOP 500 airports is useful as you plan your business in a post-COVID economy.
Methodology Note: The activity data is available at FAA.gov and the TFMSC database for “Airport.” The data is filtered to include “Business Aviation” (this eliminates other activity like airlines and most flight training) and grouped by “Physical Class,” (i.e., Jet, Turbine and Piston).
 By Mark Chambers, Managing Partner, Aviation Resource Group International
Mark Chambers is managing partner of Aviation Resource Group International (ARGI), a firm specializing in developing and managing transactions involving aviation service businesses for over 40 years. Prior to partnering with ARGI’s founder Steve Dennis, Mark worked in a progression of senior management positions leading FBO services, Part 145 maintenance and avionics operations, and Part 135 charter and a/c management operations. He holds airman ratings up to ATP and has flown 3,600 hours as PIC in both Part 91 and 135 operations, in experimental aircraft, and as a flight instructor. Mr. Chambers soloed on his 16th birthday and began his aviation career as a lineman. See argi.com for ARGI expertise, transaction experience, and publications.