
Mobility and Time Savings Driving Demand
Demand for air travel continues to grow, with airline seats full and business aviation flight hours continuing a strong upward trend. To put today’s insistence for personal and business mobility and efficiency in perspective, it took 14 years for business aviation activity to recover from the 2008-2010 “Great Recession” but only 2 years to reattain pre-Covid flight activity. Such demand will have its ups and downs, but our society is swiftly embracing the mobility and time savings of private aviation to increasingly justify the cost. In light of these underlying drivers of demand, last year we reported a strong private aviation recovery in 2021 and that recovery continued in 2022.
Annually, NATA asks Aviation Resource Group International to assemble data for the TOP 500 airports. Last year we reported a pronounced recovery but wondered about the “stickiness” of the newfound demand, especially for jet business aircraft. For 2022, pretty sticky as it turned out.
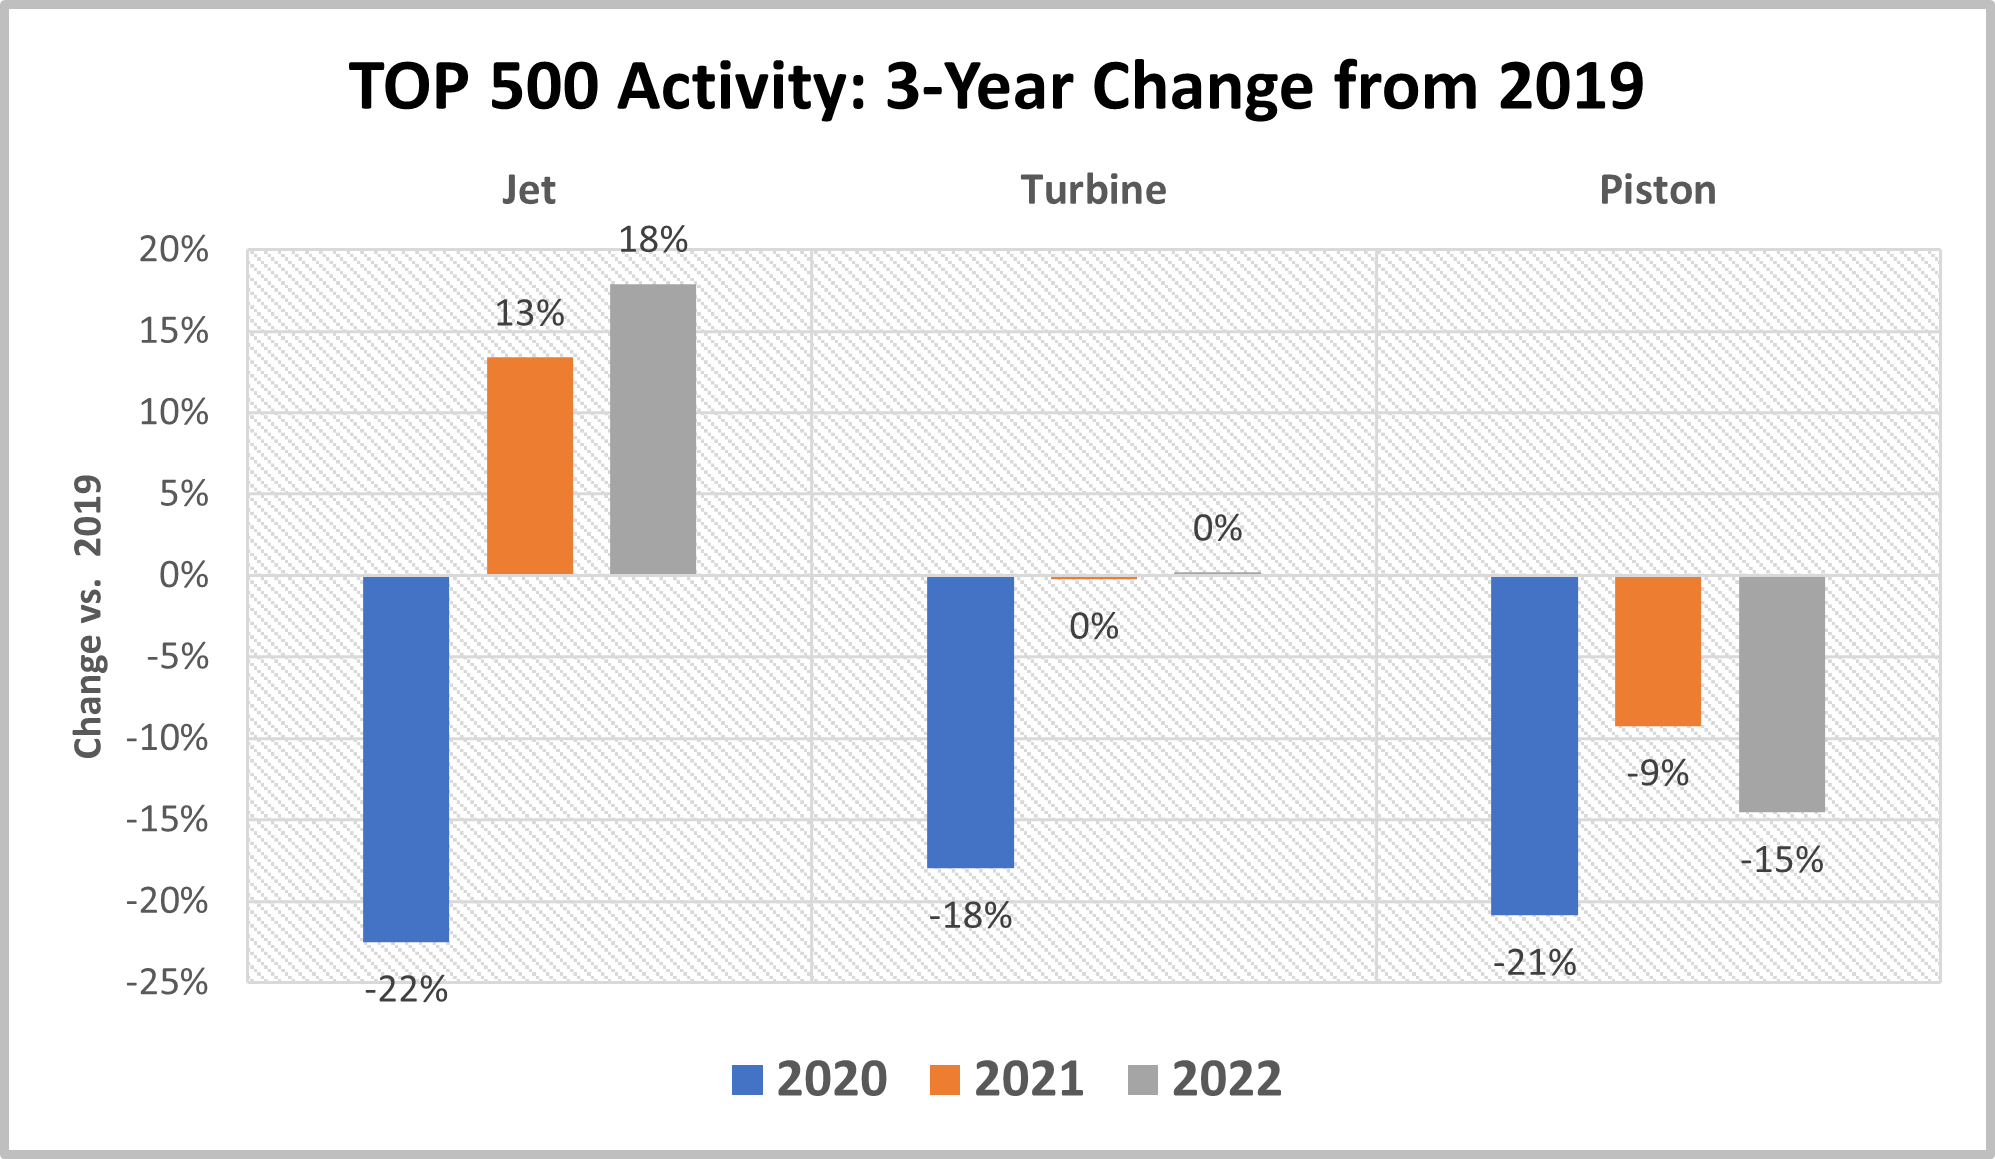
Comparing activity levels to 2019; “Jet” arrivals and departures increased 18% in 2022—slightly better than 2021 activity and a continuation of the brisk recovery from 2020 declines. “Turbine” activity in 2022 remained steady at 2019 levels, and “Piston” activity continued to decline.
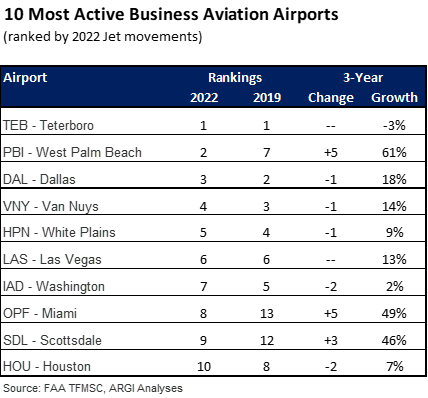
Source: FAA TFMSC, ARGI Analyses
Teterboro (TEB) remains the most active business aviation airport in the 2022 TOP 500. In the New York City (NYC) area, White Plains (HPN) Jet activity is about half that recorded at TEB. More broadly, TEB Jet activity exceeds the other five airports in the NYC area combined, with 136,855 TEB Jet movements versus 111,481 for HPN, MMU, FRG, LGA, and JFK.
The 10 most active airports in 2022 saw significant changes compared to pre-Covid 2019 Jet activity counts. West Palm Beach (PBI) increased by 61% in the 3-year period, placing PBI second behind TEB. Also in South Florida, Miami-Opa Locka (OPF) ranked eighth thanks to a 3-year growth of 49%. Further west, Scottsdale (SDL) grew by 46% to a number 9 ranking.
The airport-by-airport analyses rank the TOP 500 airports based on 2022 “Jet” activity and also show data and trends for the “Turbine” and “Piston” categories. 2022 growth rates are calculated from 2021 now that the 2020 abnormalities are mostly behind us. Airports and FBOs can use the data to track trends and compare activity data with other airports in a particular region.
I hope the accompanying listing of the TOP 500 airports is useful as you plan your business in a post-COVID economy.
Methodology Note: The activity data is available at FAA.gov and the TFMSC database for “Airports.” The data is filtered to include “Business Aviation” (this eliminates other activity like airlines and most flight training) and grouped by “Physical Class,” (i.e., Jet, Turbine and Piston).
 By Mark Chambers, Managing Partner, Aviation Resource Group International
Mark Chambers is managing partner of Aviation Resource Group International (ARGI), a firm specializing in developing and managing transactions involving aviation service businesses for over 40 years. Prior to partnering with ARGI’s founder Steve Dennis, Mark worked in a progression of senior management positions leading FBO services, Part 145 maintenance and avionics operations, and Part 135 charter and a/c management operations. He holds airman ratings up to ATP and has flown 3,600 hours as PIC in both Part 91 and 135 operations, in experimental aircraft, and as a flight instructor. Mr. Chambers soloed on his 16th birthday and began his aviation career as a lineman. See argi.com for ARGI expertise, transaction experience, and publications.